With Tableau, users can build dynamic dashboards, reports, and charts that are interactive and engaging to help them learn more from their data. Tableau software was founded in 2003 and is now owned by Salesforce after an acquisition in 2019. It has become one of the most widely used business intelligence and data analytics platforms available today.
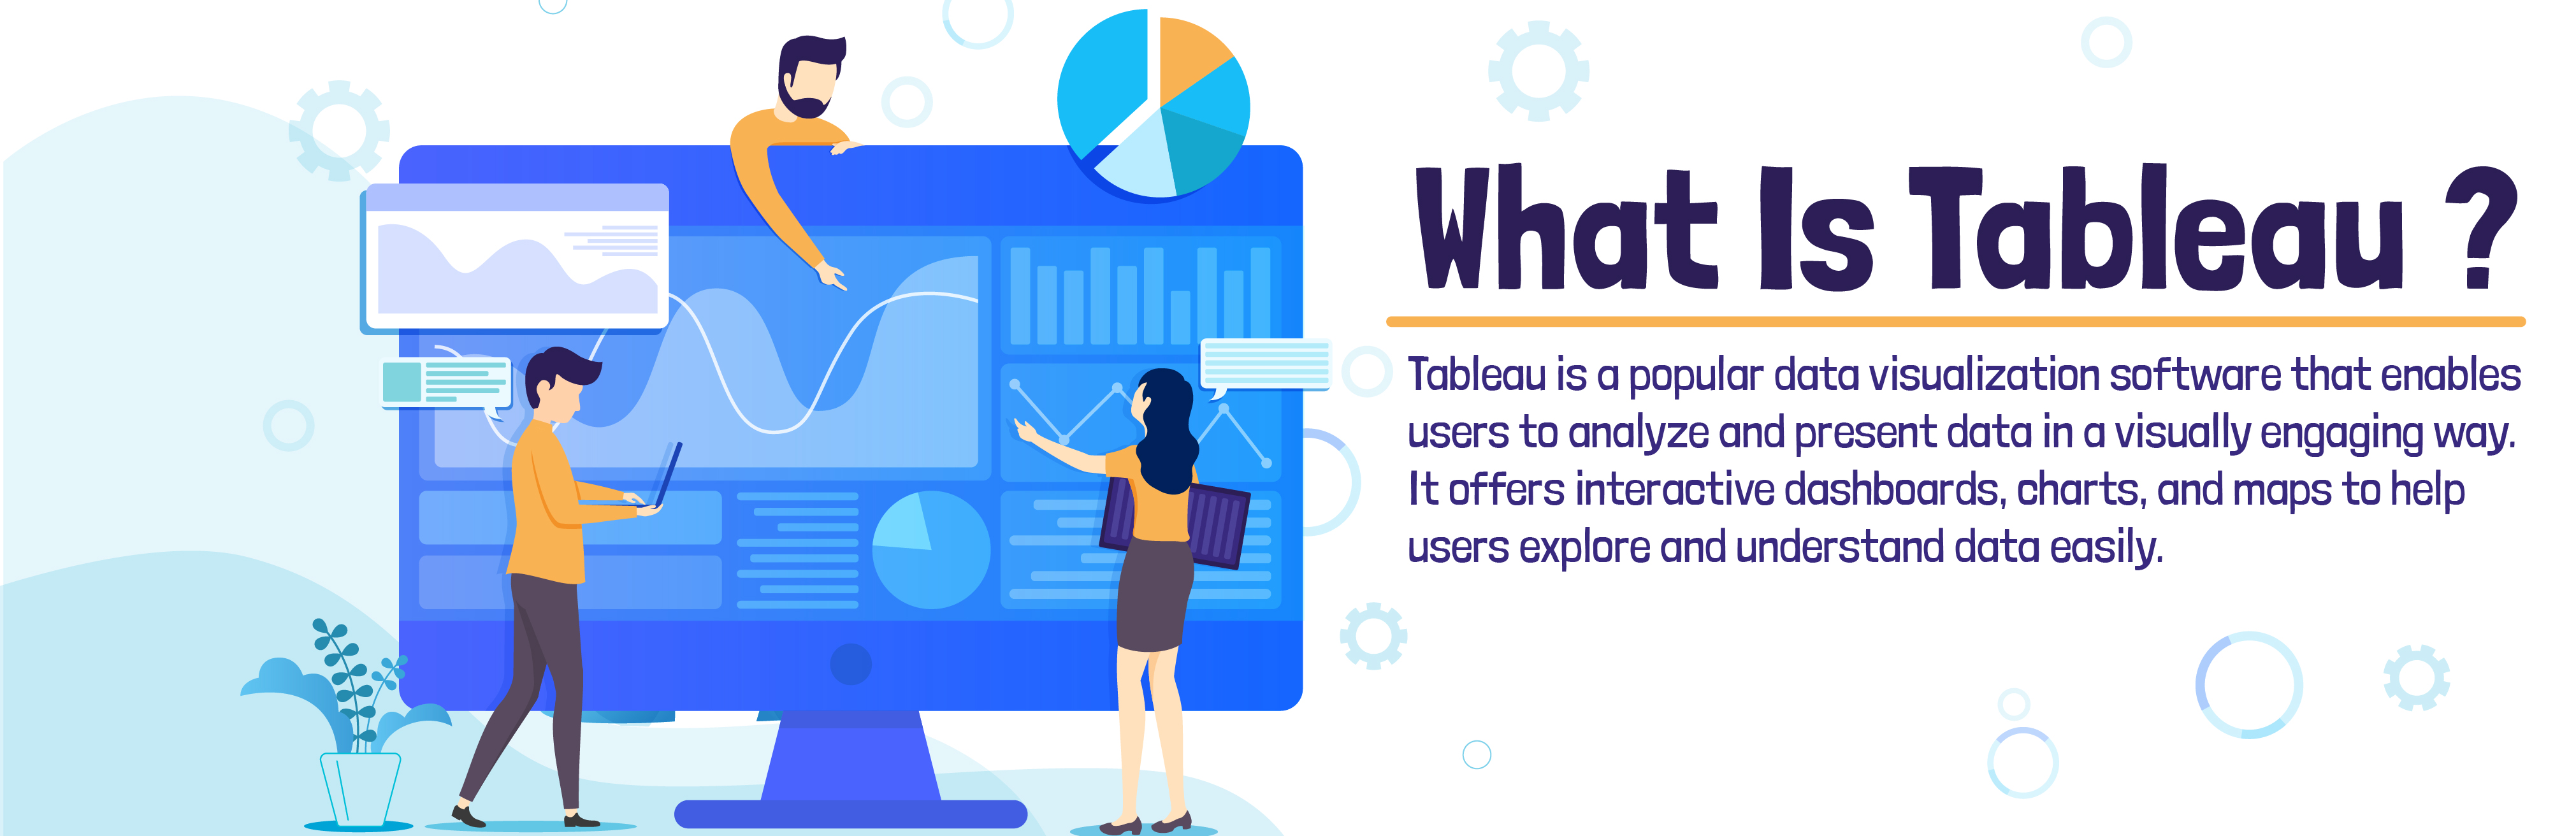
The primary objective of Tableau is to help people understand and communicate data through interactive and compelling visualizations. The platform offers a range of features and tools that allow users to connect to multiple data sources, create customized calculations, and present data in the most meaningful way possible.
One of the most impressive features of Tableau is its ease of use. Users can drag and drop data into the interface, and the software will automatically generate visualizations and dashboards. It offers a range of visualization options, including charts, maps, and tables, that can be customized to meet specific needs. It also has a user-friendly interface that makes it easy to navigate and create interactive dashboards.
Tableau offers a range of tools for data analysis and exploration, including the ability to filter, sort, and group data. Users can drill down into data to explore trends and patterns and identify areas that require further analysis. They can also create forecasts and predictions using built-in tools or through integration with other analytics tools.
Another key benefit of Tableau is its ability to connect to a wide range of data sources. It can connect to traditional databases such as SQL Server, Oracle, and MySQL, as well as cloud-based sources such as Salesforce, Amazon Redshift, and Google Analytics. Tableau also supports a range of file formats, including CSV, Excel, and PDF, making it easy to import and work with data from a range of sources.
Tableau’s ability to integrate with other analytics tools and technologies is another advantage. It can be integrated with R, Python, and other statistical tools, allowing users to perform advanced analytics and predictive modeling. It also offers APIs and SDKs, making it possible to create custom integrations and applications.
Tableau offers a range of deployment options, including on-premise and cloud-based solutions. Users can choose the deployment option that best suits their needs and budget, and Tableau offers a range of pricing plans to accommodate different usage scenarios.
In summary, Tableau is a powerful data visualization tool that allows users to create interactive and dynamic dashboards, reports, and charts to gain insights from their data. Its ease of use, ability to connect to a wide range of data sources, and integration with other analytics tools make it a popular choice for businesses and organizations looking to gain insights from their data. With its user-friendly interface and range of features, Tableau is an excellent choice for anyone looking to make sense of their data and communicate insights effectively.
 89769 88791
 Enquire Now
 89769 88791